
Email Deliverability · Inbox Placement · Email Marketing · Sender Reputation
Inbox Placement Rate: What's a Good Score and How to Improve Yours
· InboxPlacement.io Team
Updated
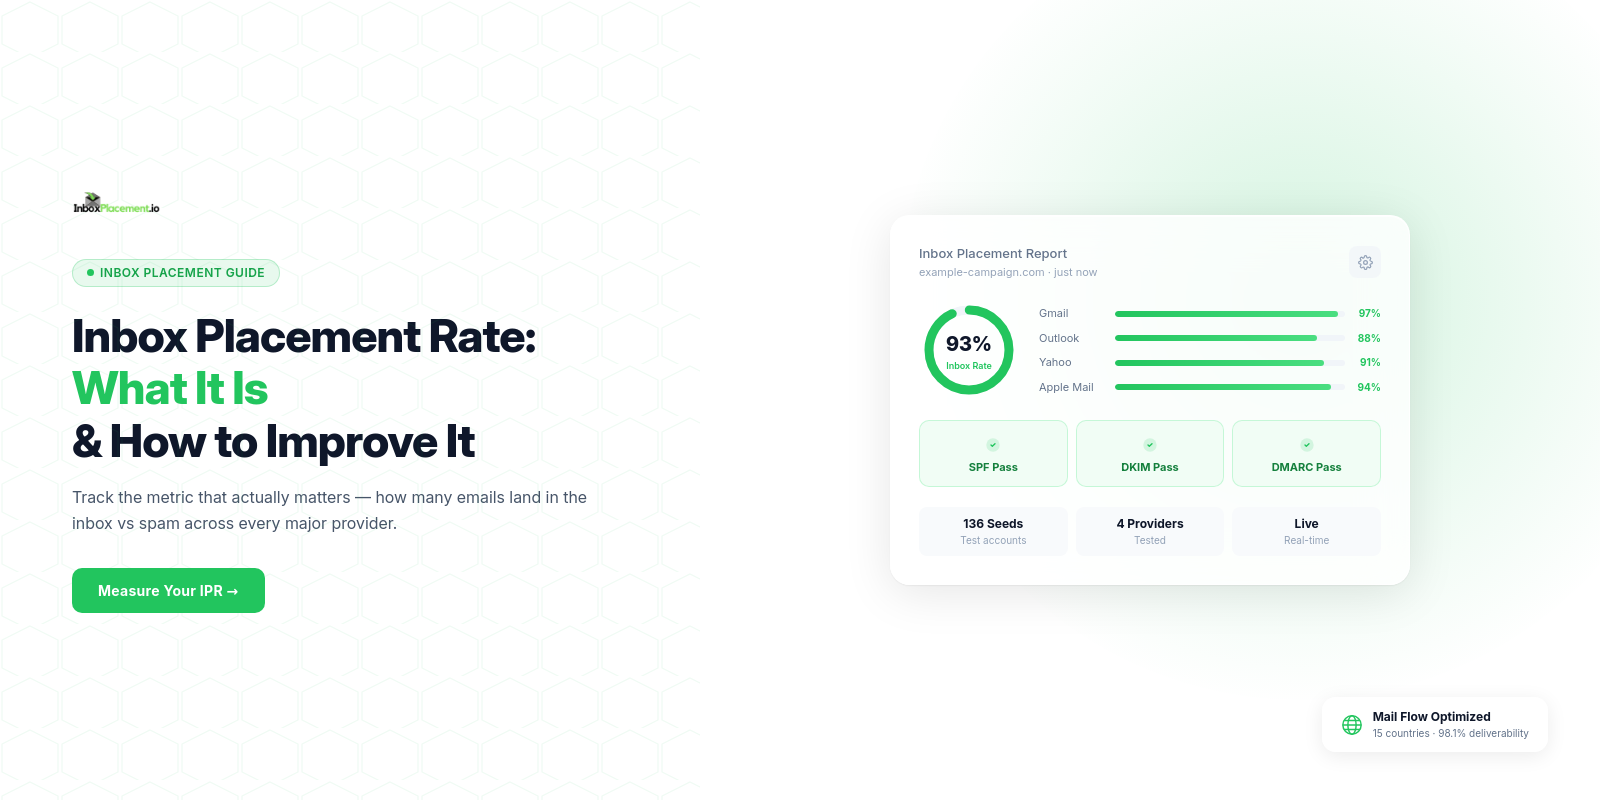
Inbox placement rate is the percentage of sent emails that arrive in the recipient's inbox folder — not the spam or junk folder, not blocked, not lost in transit. It is calculated as:
Inbox Placement Rate = (Emails Delivered to Inbox ÷ Total Emails Sent) × 100
This single metric is the most accurate measure of your email program's deliverability health. Open rates can be distorted by image loading behavior and Apple Mail's Mail Privacy Protection. Inbox placement rate cannot be gamed — either your email reached the inbox or it didn't.
Why Inbox Placement Rate Matters More Than Open Rate
Open rate measures engagement among recipients who received your email in the inbox. Inbox placement rate measures how many recipients had the opportunity to engage in the first place.
Consider two identical campaigns sent to 50,000 subscribers:
Campaign A — 70% Inbox Placement Rate:
- 35,000 emails reach the inbox
- 25% open rate → 8,750 opens
- 5% click rate → 438 clicks
Campaign B — 95% Inbox Placement Rate (After Optimization):
- 47,500 emails reach the inbox
- 25% open rate → 11,875 opens
- 5% click rate → 594 clicks
That's 156 additional clicks from the same campaign, with the same subject line, same content, and same list — just better inbox placement. At a 2% conversion rate and $100 average order value, the improvement from inbox placement alone generates $3,120 in additional revenue per campaign.
Industry Benchmark Table: What's a Good Inbox Placement Rate?
These benchmarks are based on aggregated industry data across major email providers:
| Industry / Email Type | Good IPR | Average IPR | Poor IPR |
|---|---|---|---|
| Transactional (receipts, confirmations) | 98%+ | 92–97% | Below 90% |
| B2B Marketing (newsletters, product updates) | 92%+ | 82–91% | Below 80% |
| B2C Marketing (promotions, offers) | 88%+ | 75–87% | Below 72% |
| Triggered/Behavioral (abandoned cart, re-engagement) | 94%+ | 85–93% | Below 82% |
| Cold Outreach | 80%+ | 65–79% | Below 60% |
Key insight: Transactional email achieves the highest inbox placement because recipients expect it, engage with it immediately, and rarely mark it as spam. Marketing email faces more scrutiny from filters because the audience opted in broadly, not for a specific triggered message.
Your target should always be the "Good" column for your email type. Consistently hitting "Average" means you're losing 8–15% of your audience to spam folders unnecessarily.
The 8 Factors That Hurt Inbox Placement Rate (And How to Fix Each)
1. Failed Authentication
What happens: Email providers treat unauthenticated email as suspicious by default. SPF, DKIM, or DMARC failures can route email to spam or block it entirely — regardless of content quality.
Fix: Configure SPF, DKIM, and DMARC records in your DNS. Use InboxPlacement.io's Domain Forensic Scan to verify all three are correctly set up and aligned.
2. Poor Sender Reputation
What happens: ISPs maintain rolling reputation scores for sending domains and IPs. High spam complaint rates (>0.1%), high bounce rates (>2%), or low engagement drag down your reputation score, and low reputation scores mean more aggressive filtering.
Fix: Clean your list quarterly to remove inactive subscribers. Implement double opt-in for new signups. Monitor Google Postmaster Tools for Gmail-specific reputation data.
3. High Spam Complaint Rate
What happens: When recipients click "Report Spam," it's a direct signal to ISPs that your email is unwanted. Gmail enforces a 0.1% threshold; exceeding it triggers aggressive filtering across your entire sending domain.
Fix: Make unsubscribing easier than reporting spam. Include a one-click unsubscribe link in every email. Send only to engaged subscribers — suppress anyone who hasn't opened in 6+ months.
4. Spam Trigger Content
What happens: Content filters flag emails containing known spam patterns — excessive urgency, financial promises, ALL CAPS subject lines, or specific keyword combinations. A flagged message goes to spam regardless of your reputation score.
Fix: Run a spam score check on every new email template. Address every flagged trigger before sending. Rewrite subject lines to be conversational rather than promotional.
5. Blacklist Listings
What happens: If your sending IP or domain appears on a major blacklist (Spamhaus, SpamCop, URIBL), ISPs that use those lists will filter or block your email automatically. A single blacklist listing can drop your inbox placement rate by 30–50% overnight.
Fix: Monitor blacklist status weekly. If listed, identify the cause (spam trap hit, complaint spike, sudden volume increase), fix it, and submit a delisting request. Most reputable blacklists process removal requests within 24–72 hours.
6. Low Engagement History
What happens: ISPs track whether recipients engage with your emails over time. If a significant portion of your list consistently ignores your emails (no opens, no clicks), ISPs interpret your sending as low-value and route future emails more aggressively to spam.
Fix: Segment your list by engagement level. Send to your most active subscribers first to build positive engagement signals. Run a re-engagement campaign for 60–90 day non-openers before suppressing them.
7. Sudden Sending Volume Spikes
What happens: If you normally send 5,000 emails per week and suddenly send 80,000, ISPs flag the spike as suspicious. This triggers temporary filtering that can last days or weeks.
Fix: Gradually increase sending volume (10–15% per week maximum for new increases). Warm up new IP addresses before sending to your full list.
8. Poor List Hygiene
What happens: Old or purchased email lists contain hard bounces, spam traps, and invalid addresses. High bounce rates damage sender reputation; spam trap hits trigger immediate blacklist additions.
Fix: Use email validation to clean your list before large campaigns. Remove hard bounces immediately after each send. Suppress chronic non-openers and avoid purchased lists entirely.
How to Measure Your Inbox Placement Rate
Method 1: Manual Seed List (Free, Limited)
Create test email accounts at Gmail, Outlook, Yahoo, and iCloud. Send your campaign to these accounts and manually check where each email landed.
Pros: Free
Cons: Time-consuming, limited to providers where you have accounts, can't monitor at scale, doesn't represent real-world filtering behavior for your domain
Method 2: Professional Inbox Placement Testing (Recommended)
Services like InboxPlacement.io use networks of real seed mailboxes across 30+ providers. Send your test email to a seed address, and within 5–15 minutes you receive a detailed report showing:
- Per-provider inbox/spam/not-delivered breakdown
- Overall inbox placement percentage
- Authentication status
- Content analysis with specific trigger flags
- Actionable recommendations
Pros: Accurate, fast, comprehensive, works at any sending volume
Cons: Requires a subscription (InboxPlacement.io starts at $9.99/month)
How Often Should You Test Inbox Placement?
| Scenario | Testing Frequency |
|---|---|
| New email template or major template change | Before first send |
| Regular newsletter campaign | Monthly minimum |
| High-volume promotional sends | Every send |
| After any blacklist delisting | Immediately after delisting confirmed |
| After authentication configuration changes | 48 hours after DNS propagation |
Frequently Asked Questions
What is a good inbox placement rate?
95% or higher is excellent. 85–94% is acceptable with room for improvement. Below 85% requires immediate investigation and fixes.
How do I check my inbox placement rate?
Use an inbox placement testing tool that sends to real seed mailboxes. InboxPlacement.io provides per-provider results for Gmail, Outlook, Yahoo, and AOL with authentication and content analysis included.
What is the difference between deliverability and inbox placement?
Email deliverability broadly refers to your ability to get emails delivered (not bounced). Inbox placement is specifically about which folder delivered emails land in — inbox vs. spam vs. promotions. You can have 98% deliverability and only 72% inbox placement if emails are reaching spam folders.
How often should I test inbox placement?
Test any new campaign type before sending. Test monthly for regular sends. Test immediately after any deliverability-affecting change (authentication updates, new sending IP, list changes).
What causes low inbox placement rate?
The most common causes are failed authentication (SPF/DKIM/DMARC), poor sender reputation from high complaint or bounce rates, spam trigger content, blacklist listings, and low engagement from your recipient list.
Test your inbox placement rate today. Run a free inbox placement test at InboxPlacement.io →
Related: Inbox Placement Testing 101: Ensure Your Emails Land in the Inbox · Email Spam Test: 5 Steps Before Every Send · Email Deliverability Checker: What Each Test Reveals